
Dwell Time by Industry in 2026: What Current Threat Data Really Shows
Dwell time by industry is often presented as a simple ranking:
Healthcare = X days
Finance = Y days
Government = Z days
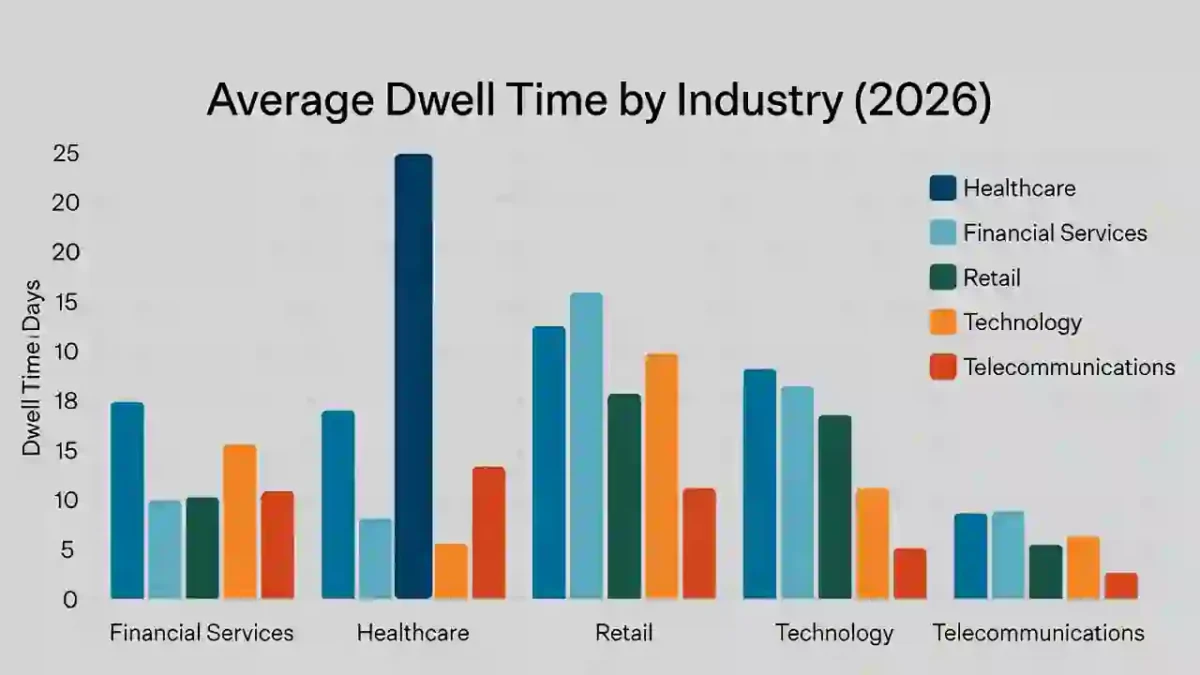
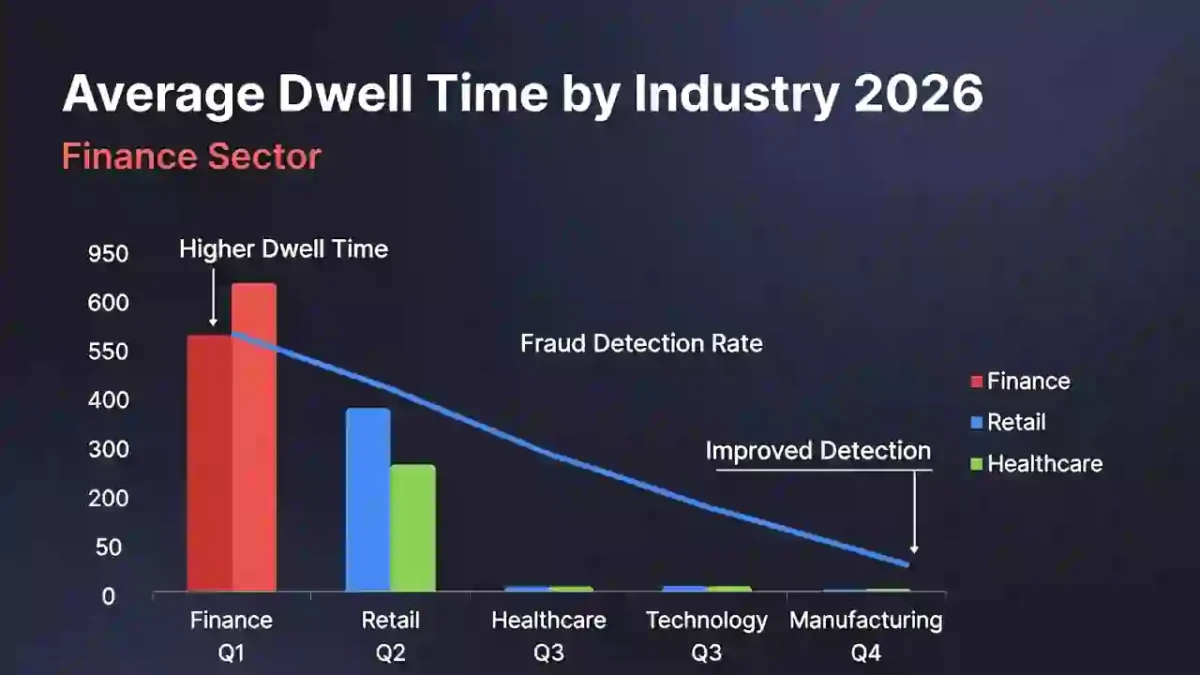
In reality, cybersecurity research rarely provides one standardized 2026 dwell-time benchmark that allows every industry to be compared directly.
Different reports measure different things:
- attacker dwell time;
- Mean Time to Detect (MTTD);
- time to identify a breach;
- time to contain;
- internal versus external discovery;
- breach lifecycle duration.
Those measurements should not be treated as interchangeable.
A stronger question is:
Which industries face the greatest visibility challenges, and what should each sector measure to understand its real attacker exposure?
That approach produces more useful and more defensible cybersecurity guidance.
Dwell Time by Industry at a Glance
| Industry | Main visibility challenge | Better measurement approach |
|---|---|---|
| Healthcare | Legacy and unmanaged assets | Median/P90 dwell time + external discovery |
| Financial Services | Identity and high-value account abuse | Privileged-account dwell time + MTTD |
| Manufacturing | OT and industrial blind spots | OT dwell time + telemetry coverage |
| Government | Distributed and legacy infrastructure | Critical-system dwell time |
| Retail | Ransomware and third-party exposure | Ransomware dwell time + supplier discovery |
| Technology | Cloud and SaaS identity abuse | Cloud account dwell time |
| Energy | OT, remote sites and ICS | OT dwell time + remote-access visibility |
The goal is not to rank industries by invented day ranges.
The goal is to identify where attackers are most likely to remain unseen.
Table of Contents
What Is Dwell Time?
Dwell time generally refers to the period between initial compromise and discovery of the intrusion.
A simplified formula is:
Dwell Time = Discovery Time − Initial Compromise Time
Example:
Initial compromise: March 1, 02:00
Discovery: March 9, 14:00
Dwell time:
8 days, 12 hours
Dwell time is primarily an exposure measurement.
It is not the same as:
- containment time;
- recovery time;
- full breach lifecycle.
For a deeper explanation, see:
and:
Dwell Time vs MTTD vs Time to Identify
These metrics are often confused.
Dwell Time
Initial compromise → discovery
MTTD
Average detection interval across multiple incidents.
Time to Identify
May be defined differently in breach-cost research and can include broader investigation activities.
That distinction is critical.
IBM, for example, reports breach lifecycle statistics such as time to identify and time to contain. These are useful, but they should not automatically be labeled dwell time.
Why Industry Dwell-Time Rankings Are Difficult
Several methodological problems make simple sector rankings unreliable.
1. Different attack types
Healthcare may experience:
- ransomware;
- credential theft;
- third-party compromise.
Finance may face:
- fraud;
- cloud identity abuse;
- privileged-account compromise.
Manufacturing may face:
- ransomware;
- OT intrusion;
- vendor remote access.
These incidents can have radically different dwell times.
2. Different infrastructure
A financial institution may have:
- mature identity monitoring;
- SIEM;
- EDR;
- 24/7 SOC coverage.
A hospital may also operate:
- medical devices;
- clinical systems;
- legacy applications;
- vendor-managed assets.
A factory may include:
- PLCs;
- industrial control systems;
- systems where endpoint agents cannot be deployed normally.
That makes a simple “average days by industry” table misleading.
3. Different statistical methods
One report may publish:
mean
another:
median
another:
time to identify
another:
dwell time
Without consistent definitions, comparison is weak.
Healthcare Dwell-Time Risk
Healthcare deserves special attention because asset visibility can be difficult.
HHS’s Healthcare Cybersecurity Performance Goals specifically emphasize asset inventory, including identifying known, unknown and unmanaged assets so organizations can detect and respond to risks more quickly. HHS also emphasizes vendor and supplier cybersecurity requirements and third-party vulnerability processes.
That matters because an attacker can remain hidden longer when security teams do not know:
- which devices exist;
- who owns them;
- whether they are monitored;
- whether logs are available.
Healthcare Threat Context in 2026
Verizon’s 2026 healthcare snapshot says ransomware-driven system intrusion remains a leading breach concern and reports that personal data exposure and third-party vendor risk remain significant.
That does not prove:
Healthcare average dwell time = 18–22 days.
A stronger conclusion is:
Healthcare environments can have persistent visibility challenges because of legacy systems, medical devices, operational constraints, and third-party dependencies.
Better Healthcare Dwell-Time Metrics
Track:
- median dwell time;
- P90/P95 dwell time;
- internally discovered incidents;
- externally discovered incidents;
- medical-device telemetry coverage;
- unmanaged asset percentage;
- third-party notification time.
Example:
| Healthcare metric | Why it matters |
|---|---|
| Median dwell time | Typical exposure window |
| P95 dwell time | Long-tail hidden compromise |
| Unmanaged assets | Detection blind spots |
| External discovery | Internal visibility weakness |
| Vendor notification | Third-party dependency |
Financial Services Dwell-Time Risk
Financial organizations often invest heavily in detection, fraud monitoring, identity analytics and 24/7 security operations.
But that does not justify a universal:
10–14 day financial-sector dwell time
benchmark.
IBM’s 2024 financial-sector research reported 168 days to identify and 51 days to contain a breach in its dataset. Those are breach-lifecycle measures, not a universal attacker dwell-time statistic.
That distinction is very important for this article.
Better Financial Services Metrics
Track:
- privileged-account dwell time;
- cloud identity MTTD;
- fraud detection latency;
- externally discovered incidents;
- third-party discovery;
- P90 high-severity detection time.
For a bank, a five-minute suspicious transaction may be more important than an overall enterprise mean.
Manufacturing Dwell-Time Risk
Manufacturing organizations face a different problem: OT and industrial visibility.
Verizon’s 2026 manufacturing report says financially motivated external threat actors continue using malware and hacking to compromise internal systems, potentially causing significant downtime and supply-chain disruption.
Manufacturing environments may include:
- OT networks;
- industrial equipment;
- remote maintenance;
- legacy protocols;
- supplier access.
Attackers may remain hidden in areas that traditional endpoint monitoring does not cover well.
Better Manufacturing Metrics
Track:
- OT dwell time;
- IT-to-OT lateral movement detection;
- remote vendor access visibility;
- unmanaged industrial asset coverage;
- critical MTTD;
- external discovery rate.
Government and Public-Sector Dwell Time
Government should not be assigned one universal dwell-time range.
A small municipality, federal department, defense organization and public university can have completely different:
- budgets;
- architecture;
- telemetry;
- staffing;
- threat models.
Verizon’s 2026 DBIR provides a dedicated public-sector snapshot, reflecting the fact that industry-specific risk differs substantially.
A better public-sector dashboard tracks:
- critical-system dwell time;
- privileged identity detection;
- externally discovered incidents;
- alert backlog age;
- legacy asset visibility;
- contractor access.
Retail Dwell-Time Risk
Verizon’s 2026 retail snapshot says breaches nearly doubled in its dataset, driven largely by external financially motivated threat actors, with system intrusion and ransomware targeting internal corporate data.
Retail security teams should therefore pay special attention to:
- ransomware dwell time;
- e-commerce compromise;
- credential abuse;
- supplier incidents;
- payment environment visibility.
Technology and Cloud Dwell Time
Technology companies often have stronger telemetry, but cloud and SaaS create different exposure patterns.
Attackers may remain active through:
- OAuth applications;
- stolen session tokens;
- API keys;
- cloud administrator accounts;
- CI/CD credentials.
Traditional endpoint controls may not detect these.
A useful cloud-focused metric is:
Time from first unauthorized cloud action → discovery
rather than only endpoint MTTD.
Why “Finance Is Better Than Healthcare” Is Too Simplistic
Your current article says finance generally detects threats faster and healthcare remains highly exposed.
That may be true in some datasets or individual organizations, but the broader statement is too strong without comparable evidence.
The better framing is:
Sector architecture and threat patterns influence detection risk, but performance varies widely between organizations within the same industry.
One mature hospital can outperform one poorly managed bank.
Industry label alone does not determine dwell time.
What IBM Data Is Useful For
IBM’s data is still valuable—when labeled correctly.
IBM’s 2025 report found organizations had a mean identify-and-contain lifecycle of 241 days.
IBM’s 2026 report says the global average breach cost rose to $4.99 million, and organizations using extensive AI and automation in security saw substantial cost savings compared with those using none.
These statistics support the value of:
- faster detection;
- stronger response;
- automation;
- better visibility.
But neither statistic should be rewritten as a universal sector dwell-time benchmark.
Healthcare Cost Does Not Equal Healthcare Dwell Time
IBM’s healthcare research has historically shown healthcare breaches to be especially expensive.
Its current general breach overview says healthcare had the highest average breach cost among industries in 2025 at $7.42 million.
That supports the importance of cybersecurity in healthcare.
It does not prove a specific healthcare dwell time.
Keep:
cost
and:
dwell time
separate.
Dwell Time and Industry Risk Should Be Segmented by Attack Type
A much stronger benchmark strategy is:
Healthcare
Separate:
- ransomware;
- credential compromise;
- third-party incidents.
Finance
Separate:
- privileged account compromise;
- fraud;
- cloud identity attacks.
Manufacturing
Separate:
- ransomware;
- OT intrusion;
- vendor compromise.
Retail
Separate:
- e-commerce;
- ransomware;
- payment compromise.
This makes data far more actionable.
Mean vs Median Dwell Time
Imagine one industry’s incidents are:
1 day
2 days
3 days
4 days
200 days
Mean:
42 days
Median:
3 days
The difference is enormous.
Therefore, any industry benchmark should state:
- mean;
- median;
- sample size;
- incident population;
- measurement period.
Without those, the benchmark is incomplete.
Why P90 and P95 Matter More
A sector may have:
Median dwell time: 2 days
but:
P95 dwell time: 90 days
That means most incidents are discovered fairly quickly, but a small number stay hidden for months.
Those long-tail cases often represent:
- sophisticated attackers;
- unmanaged assets;
- third-party compromise;
- edge-device intrusion.
For boards, that long tail may matter more than the median.
Industry Dwell-Time Measurement Framework
I recommend using this model:
| Sector | Median | P90/P95 | Internal discovery | Primary blind spot |
|---|---|---|---|---|
| Healthcare | Internal metric | Internal metric | Track | Medical/unmanaged assets |
| Finance | Internal metric | Internal metric | Track | Identity/cloud |
| Manufacturing | Internal metric | Internal metric | Track | OT |
| Government | Internal metric | Internal metric | Track | Legacy/distributed assets |
| Retail | Internal metric | Internal metric | Track | Third-party/e-commerce |
| Technology | Internal metric | Internal metric | Track | SaaS/cloud identities |
This is far more credible than publishing invented industry averages.
Build Your Own Dwell-Time Benchmark
Step 1: Define Initial Compromise
Determine how you estimate:
- first access;
- first malicious activity;
- first observable event.
Step 2: Define Discovery
Decide whether discovery means:
- first alert;
- analyst recognition;
- confirmed incident.
Use one definition.
Step 3: Record Discovery Source
Was the incident found by:
- SOC;
- user;
- supplier;
- customer;
- researcher;
- law enforcement;
- attacker?
Step 4: Calculate Dwell Time per Incident
Example:
Compromise: May 1
Discovery: May 5
Dwell time:
4 days
Step 5: Report Median
For multiple incidents, median is often useful when long outliers exist.
Step 6: Add P90/P95
This identifies stealthy long-duration cases.
Step 7: Segment
Break down results by:
- severity;
- attack type;
- environment;
- industry/business unit.
Example Quarterly Dwell-Time Dashboard
| Metric | Q1 | Q2 | Q3 |
|---|---|---|---|
| Median dwell time | 4.2 days | 3.1 days | 2.4 days |
| P90 dwell time | 28 days | 18 days | 12 days |
| Internal discovery | 71% | 78% | 83% |
| Cloud dwell time | 5.8 days | 4.1 days | 2.9 days |
| Third-party dwell time | 17 days | 13 days | 9 days |
These numbers are illustrative.
Use your own incident data.
Dwell Time vs MTTD by Industry
MTTD and dwell time should not be treated as the same metric.
A company may have:
MTTD = 20 minutes
for endpoint malware,
but:
dwell time = 90 days
for one stealthy cloud or edge compromise.
That is not contradictory.
The metrics describe different populations and perspectives.
For the complete explanation, see Dwell Time vs MTTD.
Dwell Time vs Detection Speed by Industry
Your previous Article #26 now covers detection-speed methodology.
Use that article as the companion page:
Detection Speed Benchmarks by Industry
The distinction should be:
Article #26: How quickly sectors detect threats operationally.
Article #27: How long attackers remain undiscovered and what creates prolonged exposure.
This prevents SEO cannibalization.
Dwell Time and Containment
Dwell time ends around discovery/detection.
Containment occurs afterward.
Example:
Initial compromise: Day 1
Discovery: Day 8
Containment: Day 8 + 45 minutes
Dwell time:
approximately 7 days
Containment time:
45 minutes
Do not merge them.
For containment, see Mean Time to Contain.
Dwell Time and Regulatory Readiness
Long dwell time can increase:
- data exposure;
- business impact;
- investigation complexity.
But dwell time itself is not a legal reporting clock.
For example:
SEC: reporting generally turns on materiality determination.
UK GDPR: reporting turns on awareness of a reportable personal data breach.
Do not write:
Long dwell time automatically means a regulatory deadline was missed.
Instead write:
Long dwell time can make impact assessment and regulatory readiness more difficult after discovery.
For details, see Cyber Incident Reporting Deadlines US vs UK.
How to Reduce Dwell Time Across Industries
1. Improve Asset Inventory
HHS specifically emphasizes asset inventory as a way to identify known, unknown, and unmanaged assets so risks can be detected and addressed more quickly.
2. Expand Telemetry
Monitor:
- endpoints;
- identity;
- cloud;
- network;
- SaaS;
- edge devices;
- OT where appropriate.
3. Improve Identity Monitoring
Watch for:
- suspicious administrator activity;
- unusual session use;
- token abuse;
- MFA changes.
4. Improve Third-Party Visibility
HHS explicitly recommends vendor/supplier cybersecurity requirements and third-party vulnerability disclosure processes in healthcare; the same principle applies broadly to critical suppliers.
5. Monitor Long-Tail Incidents
Do not stop at the median.
Find the attacks that remained hidden longest.
6. Segment Detection by Environment
Compare:
- endpoint;
- cloud;
- OT;
- identity;
- supplier.
7. Run Threat-Hunting Exercises
Threat hunting can help identify activity that has bypassed normal alerting.
Common Industry Dwell-Time Mistakes
1. Publishing Unverified Sector Averages
Avoid “18–22 days” unless a source actually publishes that number.
2. Calling Time-to-Identify Dwell Time
IBM’s identify metric is not automatically attacker dwell time.
3. Comparing Mean and Median Directly
Always label the statistic.
4. Ranking Industries Without Comparable Data
The data may use different methodologies.
5. Ignoring Internal Differences
Two healthcare organizations can have radically different maturity.
6. Ignoring Attack Type
Ransomware and espionage behave differently.
7. Ignoring Third Parties
Supplier-originated compromises can stay hidden longer.
Frequently Asked Questions
What industry has the longest dwell time in 2026?
There is no authoritative universal 2026 dataset that reliably ranks every major industry using the same dwell-time methodology.
Sector-specific visibility challenges vary considerably.
Is healthcare dwell time 18–22 days?
I could not verify an authoritative 2026 primary source establishing 18–22 days as the universal healthcare dwell-time benchmark.
I recommend removing that claim.
Is financial-services dwell time 10–14 days?
I could not verify that as a universal 2026 benchmark either.
IBM has published financial-sector time to identify and time to contain figures, but those are not the same as attacker dwell time.
What is the difference between dwell time and IBM’s time to identify?
Dwell time generally measures attacker presence from compromise to discovery.
IBM’s time-to-identify metric is part of its breach lifecycle methodology.
Do not automatically treat the two as equivalent.
Why is healthcare difficult to monitor?
HHS identifies asset inventory, unmanaged assets, known vulnerabilities and third-party risk as important healthcare cybersecurity issues.
Why is manufacturing different?
Manufacturing environments often include OT and industrial systems alongside enterprise IT, creating visibility and operational challenges. Verizon’s 2026 manufacturing snapshot also emphasizes malware, hacking, operational downtime and supply-chain disruption.
What is the best way to benchmark dwell time?
Use your own:
- median;
- P90/P95;
- discovery source;
- attack type;
- environment.
Then compare trends quarter over quarter.
Final Takeaway
There is no defensible universal 2026 table showing exact average dwell time for healthcare, finance, government and other industries.
Your current:
Healthcare: 18–22 days
Finance: 10–14 days
Government: 16–20 days
table should therefore be removed.
The better industry comparison is based on visibility risk:
Healthcare: legacy and unmanaged clinical assets.
Finance: identity and high-value account abuse.
Manufacturing: OT and remote-access visibility.
Government: distributed and legacy infrastructure.
Retail: ransomware and third-party exposure.
Technology: cloud/SaaS identity.
Current sources support those different threat and architecture patterns, but they do not support pretending each sector has one universal dwell-time number. Verizon’s 2026 DBIR explicitly provides different industry snapshots, while HHS provides healthcare-specific goals around asset visibility and vendor risk.
The strongest question is therefore not:
“Is our industry’s average dwell time 12 or 20 days?”
It is:
“Which types of attackers remain hidden longest in our environment, and which assets or dependencies create that blind spot?”