
Cyber Attack Detection Speed by Industry 2026: What the Data Really Shows
Cybersecurity teams often want to know:
How fast should our industry detect a cyber attack?
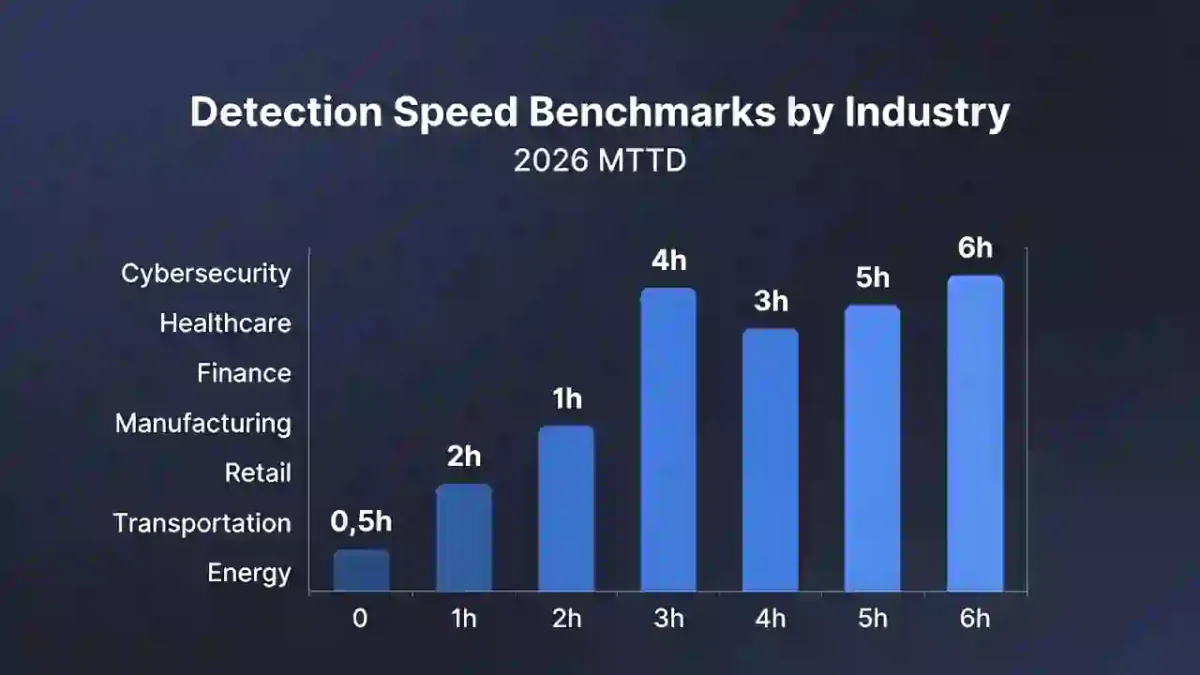
The problem is that there is no single authoritative 2026 table showing comparable detection times for every major sector.
Published cybersecurity reports frequently measure different things:
- Mean Time to Detect (MTTD)
- median dwell time
- time to identify a breach
- alert acknowledgement time
- incident validation time
- time to contain
- internally discovered vs externally reported incidents
These metrics should not be mixed together.
A healthcare organization, manufacturer, bank, government agency, retailer, and cloud company may face completely different visibility challenges.
For that reason, detection speed benchmarks by industry should be interpreted as risk context, not fixed universal time targets.
A better approach is to ask:
Which factors make detection harder in our sector, and which metrics should we track to expose those weaknesses?
NIST’s current incident-response guidance emphasizes improving the effectiveness and efficiency of detection, response, and recovery across the organization rather than prescribing universal detection-time benchmarks. NIST finalized SP 800-61 Rev. 3 in April 2025, replacing Rev. 2.
Detection Speed by Industry at a Glance
| Industry | Common detection challenge | Better metric to track |
|---|---|---|
| Financial Services | Identity abuse, high-value targeting, third parties | Critical MTTD + external discovery |
| Healthcare | Legacy systems, clinical devices, vendor exposure | P90 detection + unmanaged asset coverage |
| Manufacturing | OT, ICS and edge-device visibility | OT detection coverage + dwell time |
| Government | Complex infrastructure and distributed ownership | Critical MTTD + backlog age |
| Retail | Ransomware, e-commerce and supplier exposure | Payment/cloud detection + supplier alerts |
| Technology | Cloud, SaaS and identity compromise | Cloud MTTD + token-abuse detection |
| Energy & Utilities | IT/OT convergence and safety constraints | OT detection latency + critical asset coverage |
This is more useful than assigning unsupported “6-hour” or “72-hour” averages.
Table of Contents
What Is Detection Speed?
Detection speed describes how quickly suspicious or malicious activity is discovered after a defined starting point.
It can be measured using:
- Mean Time to Detect (MTTD)
- median detection time
- alert latency
- Mean Time to Acknowledge
- validation time
- P90/P95 detection time
For internal performance, a common metric is:
MTTD = Total Detection Time ÷ Number of Incidents
But a good MTTD program must define:
When does the clock start?
For example:
- initial compromise;
- first confirmed malicious action;
- first observable malicious activity.
The organization should use the same definition consistently.
For the detailed calculation, see Mean Time to Detect (MTTD).
Why Industry Detection Benchmarks Are Difficult to Compare
A sector comparison may look simple:
Finance = X hours
Healthcare = Y hours
But that hides several methodological problems.
Different attack types
Finance may face:
- credential theft;
- fraud;
- cloud compromise.
Manufacturing may face:
- ransomware;
- OT compromise;
- remote-access abuse.
Healthcare may face:
- ransomware;
- third-party compromise;
- identity attacks;
- legacy-device exposure.
Detection times for these attack types can differ dramatically.
Different Infrastructure
A technology company may have:
- modern cloud logging;
- EDR;
- identity telemetry.
A hospital may also have:
- medical devices;
- legacy applications;
- vendor-managed systems;
- clinical availability constraints.
A factory may include:
- programmable logic controllers;
- industrial control systems;
- safety systems;
- equipment that cannot accept standard endpoint agents.
NIST SP 800-82 Rev. 3 specifically notes that OT environments must balance cybersecurity with unique performance, reliability and safety requirements.
That makes direct “hours by industry” comparisons unreliable.
Different Statistical Measures
One report may publish:
mean
another:
median
another:
dwell time
another:
identify-and-contain lifecycle
These are different metrics.
Never compare them as though they are equivalent.
For the full distinction, see Dwell Time vs MTTD and MTTD vs MTTR vs MTTC vs Dwell Time.
What Verizon 2026 Actually Shows by Industry
Verizon’s 2026 Data Breach Investigations Report provides useful sector-specific risk information, but it should not be turned into fabricated MTTD values.
The overall 2026 DBIR reports that:
- 31% of breaches began with exploitation of software vulnerabilities;
- 48% of breaches involved ransomware;
- the report includes industry-specific snapshots for healthcare, manufacturing, retail and other sectors.
The value of these industry snapshots is understanding how sectors are attacked, not claiming every sector has a fixed detection-time average.
Healthcare Detection Challenges
Healthcare has several unique detection problems.
Verizon’s 2026 healthcare snapshot says ransomware-driven system intrusion remains a leading breach concern and reports that personal data is frequently targeted, while third-party vendor risk is substantial.
Healthcare organizations may also operate:
- medical imaging systems;
- clinical workstations;
- IoT medical devices;
- legacy applications;
- vendor-managed systems;
- systems with strict availability requirements.
HHS’s Healthcare and Public Health Cybersecurity Performance Goals explicitly emphasize:
- vulnerability reduction;
- asset inventory;
- visibility into unmanaged assets;
- third-party vulnerability processes.
These issues can affect detection quality because:
unknown assets are difficult to monitor.
Better Healthcare Metrics
Rather than publishing:
Healthcare average detection time = 24–72 hours
track:
- Critical MTTD
- P90 detection time
- unmanaged asset percentage
- EDR coverage
- third-party discovery rate
- medical-device logging coverage
- high-risk incident external discovery
Example:
| Healthcare KPI | Purpose |
|---|---|
| Critical MTTD | Detect high-impact attacks quickly |
| P90 detection | Find long-tail delays |
| Medical asset visibility | Identify monitoring gaps |
| Third-party discovery | Measure vendor dependence |
| Critical log coverage | Improve forensic visibility |
Financial Services Detection Context
Financial organizations often invest heavily in:
- fraud monitoring;
- identity analytics;
- SIEM;
- EDR;
- 24/7 operations.
But that does not justify claiming:
financial services detect attacks in 6–12 hours.
The sector is also highly attractive to attackers because of:
- financial assets;
- customer data;
- privileged identity;
- digital transaction infrastructure.
A bank may detect payment fraud very quickly while a stealthy identity compromise remains hidden much longer.
Better Financial Services Metrics
Track:
- Critical MTTD
- privileged account MTTD
- suspicious transaction detection latency
- external discovery rate
- cloud identity detection
- supplier incident notification time
A board-level question might be:
Are high-impact identity and fraud-related incidents being detected faster quarter-over-quarter?
That is more meaningful than comparing to an unsupported global benchmark.
Manufacturing Detection Challenges
Verizon’s 2026 manufacturing snapshot highlights external financially motivated attackers using malware and hacking, with potential operational downtime and supply-chain disruption.
Manufacturing detection can be complicated by:
- IT/OT convergence;
- industrial control systems;
- legacy protocols;
- limited endpoint agents;
- vendor remote access;
- long equipment lifecycles.
NIST SP 800-82 Rev. 3 specifically addresses security for OT systems while preserving safety, reliability, and performance.
Better Manufacturing Metrics
Track:
- OT asset visibility
- OT detection coverage
- unauthorized remote-access detection
- IT-to-OT lateral movement alerts
- OT dwell time
- critical MTTD
- vendor access monitoring
Example:
| Manufacturing metric | Why it matters |
|---|---|
| OT telemetry coverage | Shows monitoring blind spots |
| Critical MTTD | Measures serious incident detection |
| IT→OT detection latency | Shows lateral movement visibility |
| Vendor session monitoring | Reduces third-party exposure |
Energy and Utilities Detection Context
Energy environments often combine:
- enterprise IT;
- OT;
- SCADA;
- remote sites;
- distributed control systems.
These environments may have strong monitoring in some parts and limited visibility in others.
CISA’s Cross-Sector Cybersecurity Performance Goals specifically recognize both IT and OT environments and provide sector-specific goals for energy and other critical infrastructure.
Therefore, a single “12–24 hour” detection number tells very little.
Better Energy Metrics
Track:
- critical OT alert latency;
- network anomaly detection;
- remote access visibility;
- asset coverage;
- unauthorized configuration change detection;
- IT/OT correlation;
- P90 critical detection time.
The correct goal is:
detect threats quickly enough to protect safety and continuity without destabilizing critical operations.
Government and Public Sector Detection Context
Government environments can vary enormously.
A small municipality and a national security agency should not be placed under the same MTTD benchmark.
Challenges can include:
- distributed agencies;
- legacy applications;
- inconsistent monitoring;
- varied budgets;
- contractor access;
- complex ownership.
A better government dashboard would track:
- Critical MTTD
- alert backlog age
- privileged account detection
- internet-facing asset coverage
- supplier incident notification
- externally discovered incidents
Retail Detection Context
Verizon’s 2026 retail snapshot says breaches nearly doubled in its dataset, driven mainly by external financially motivated attackers, with system intrusion and ransomware targeting internal corporate data.
Retail detection needs to cover:
- e-commerce platforms;
- customer identity;
- corporate endpoints;
- payment systems;
- suppliers;
- cloud workloads.
Better Retail Metrics
Track:
- e-commerce attack detection latency;
- ransomware MTTD;
- payment environment visibility;
- supplier alert latency;
- credential-abuse detection;
- externally discovered incidents.
Technology and Cloud Detection Context
Technology companies often have strong telemetry.
But cloud and SaaS environments create their own blind spots.
Attackers may abuse:
- OAuth applications;
- API keys;
- cloud identities;
- session tokens;
- CI/CD credentials.
Traditional endpoint monitoring may not see these actions.
A technology company’s detection dashboard should therefore distinguish:
endpoint MTTD
from:
cloud identity MTTD.
Example
Suppose:
Endpoint MTTD = 12 minutes
but:
Cloud identity MTTD = 4 hours
An overall company average could hide the real weakness.
Segmenting by environment produces actionable insight.
Cybersecurity Time Industry Detection Model
Instead of publishing unsupported average hours, I recommend this framework:
| Sector | Detection priority | Main visibility concern |
|---|---|---|
| Finance | Identity/fraud | Privileged access |
| Healthcare | Ransomware/clinical | Legacy and unmanaged assets |
| Manufacturing | IT/OT | Industrial telemetry |
| Energy | OT/remote systems | Distributed control |
| Government | Critical services | Distributed ownership |
| Retail | E-commerce/ransomware | Supplier and payment exposure |
| Technology | Cloud/identity | Tokens and SaaS |
This gives readers original practical value without pretending the data supports exact hourly rankings.
Why “Financial Services Lead Detection” Is Too Strong
Your current article states:
Financial institutions consistently lead detection speed benchmarks.
I recommend removing that statement.
Even if financial institutions often have mature monitoring, there is not enough consistent cross-sector 2026 evidence to establish a universal ranking of:
Finance #1
Technology #2
Energy #3
and so on.
Instead say:
Some highly regulated financial organizations maintain mature monitoring and 24/7 detection programs, but detection performance varies significantly between organizations and attack types.
That is much more defensible.
Why Healthcare Is Not Automatically “Slow”
The same applies to healthcare.
Do not write:
Healthcare organizations detect attacks in 24–72 hours.
Some hospitals may have excellent SOC coverage.
Others may have serious visibility gaps.
The real challenge is architectural complexity and asset diversity.
HHS’s cybersecurity goals specifically emphasize asset inventories because unknown and unmanaged assets make rapid detection and response more difficult.
Mean vs Median Industry Detection
Suppose a sector dataset contains:
10 min
20 min
25 min
30 min
100 days
The mean is massively distorted by one incident.
The median better represents the middle event.
Therefore, industry comparisons should state whether the number is:
- mean;
- median;
- P90;
- P95.
Without that information, the benchmark is incomplete.
Use P90 and P95 for Sector Risk
Long-tail detection is particularly important.
Example:
Median Critical MTTD: 17 minutes
but:
P95 Critical MTTD: 11 hours
That means most attacks are detected quickly, while a small number remain hidden much longer.
Those slow incidents often reveal:
- unsupported assets;
- blind spots;
- third-party dependency;
- unusual attack techniques.
Internal Discovery vs External Discovery
Another useful sector metric is:
Who discovered the incident?
Track:
- internal SOC;
- user;
- supplier;
- customer;
- law enforcement;
- security researcher;
- attacker.
A high proportion of externally discovered serious incidents may indicate weak internal visibility.
This metric is useful across every industry.
Detection Speed vs Dwell Time
These metrics are related but not identical.
Detection speed / MTTD
measures organizational detection performance.
Dwell time
typically describes attacker presence before discovery.
Do not use published dwell-time research as though it were sector MTTD.
For a detailed explanation, see Dwell Time vs MTTD.
Detection Speed vs Containment
Fast detection does not guarantee fast containment.
Example:
Attack detected: 09:00
Incident confirmed: 09:10
Effective containment: 14:00
Detection was fast.
Containment was slow.
For the containment metric, see Mean Time to Contain.
Detection Speed and Regulatory Readiness
Detection can affect compliance readiness because organizations need reliable facts to determine whether legal reporting requirements apply.
But detection time is not automatically a regulatory deadline.
For example:
- SEC reporting generally turns on materiality determination;
- UK GDPR turns on awareness of a reportable personal data breach;
- other regimes use different triggers.
Therefore:
MTTD ≠ SEC filing clock
and:
MTTD ≠ UK GDPR 72-hour clock
For the legal comparison, see Cyber Incident Reporting Deadlines: US vs UK.
How to Build Your Own Industry-Adjusted Detection Benchmark
Rather than downloading an unsupported industry number, build an internal baseline.
Step 1: Define MTTD
Write:
Detection time begins at ______ and ends at ______.
Step 2: Segment by Severity
Measure:
- Critical
- High
- Medium
- Low
Do not compare them blindly.
Step 3: Segment by Environment
Examples:
- endpoint;
- cloud;
- identity;
- OT;
- SaaS;
- third party.
Step 4: Track Mean and Median
Use both.
Step 5: Add P90/P95
Find the long-tail cases.
Step 6: Track Discovery Source
Internal vs external.
Step 7: Compare Quarter Over Quarter
A useful trend is:
| Metric | Q1 | Q2 | Q3 |
|---|---|---|---|
| Critical median MTTD | 30 min | 23 min | 17 min |
| P90 MTTD | 4.1 hrs | 3.0 hrs | 2.2 hrs |
| External discovery | 22% | 17% | 12% |
| Cloud MTTD | 61 min | 48 min | 35 min |
These numbers are illustrative.
The value is the trend.
Detection Benchmark Scorecard by Industry
Instead of hours, a useful industry framework looks like this:
Healthcare
Prioritize:
- critical MTTD;
- medical asset coverage;
- third-party discovery;
- unmanaged asset visibility.
Finance
Prioritize:
- privileged identity detection;
- fraud detection;
- cloud identity MTTD;
- supplier notification time.
Manufacturing
Prioritize:
- OT detection coverage;
- IT-to-OT lateral movement;
- vendor remote-access monitoring;
- ransomware detection.
Energy
Prioritize:
- critical OT visibility;
- remote-site telemetry;
- configuration-change detection;
- network anomalies.
Government
Prioritize:
- Critical MTTD;
- backlog;
- distributed asset coverage;
- contractor access.
Retail
Prioritize:
- e-commerce detection;
- credential abuse;
- ransomware;
- supplier incidents.
Technology
Prioritize:
- cloud identity;
- OAuth/token abuse;
- CI/CD compromise;
- SaaS activity.
This is a much stronger sector comparison than unsupported hour ranges.
How Organizations Can Improve Detection Speed
1. Improve Asset Visibility
You cannot monitor assets you do not know exist.
CISA’s Cross-Sector Cybersecurity Performance Goals emphasize foundational practices that organizations can use to improve cybersecurity maturity.
2. Improve Log Coverage
Prioritize:
- endpoint;
- identity;
- cloud;
- VPN;
- firewall;
- critical application;
- OT where feasible.
3. Tune High-Risk Detections
Focus on:
- privileged account abuse;
- vulnerability exploitation;
- lateral movement;
- unusual cloud activity;
- ransomware;
- high-volume data transfer.
4. Segment Metrics
Do not report one MTTD for everything.
5. Monitor Third Parties
Supplier notification can dominate incident discovery.
6. Improve Analyst Triage
A good alert sitting unreviewed does not help.
Track MTTA and queue age.
7. Test Detection Controls
Use:
- purple-team exercises;
- detection validation;
- tabletop exercises;
- attack simulations.
NIST’s current incident-response guidance emphasizes integrating detection, response, and recovery into broader risk management.
Common Industry Benchmark Mistakes
Mistake 1: Publishing Unsupported Hour Ranges
Do not label guesses as “2026 data.”
Mistake 2: Ranking Industries Without Comparable Data
Different datasets and attack types make rankings unreliable.
Mistake 3: Treating Dwell Time as MTTD
They are different metrics.
Mistake 4: Comparing Mean With Median
Always state the statistic.
Mistake 5: Ignoring Environment Type
Cloud, endpoints and OT behave differently.
Mistake 6: Ignoring External Discovery
A SOC-discovered attack differs from one reported by law enforcement.
Mistake 7: Using Regulatory Deadlines as Detection Benchmarks
Legal clocks are separate.
Frequently Asked Questions
What is a good cyber attack detection time?
There is no universal industry-wide answer.
Appropriate detection targets depend on:
- severity;
- attack type;
- system criticality;
- telemetry;
- organizational risk.
Does finance have the fastest detection time?
There is not enough comparable authoritative 2026 data to claim that financial services universally have the fastest MTTD.
Some financial organizations operate mature 24/7 security programs, but performance varies widely.
Is healthcare detection always slower?
No.
Healthcare environments can present unique visibility challenges, especially around legacy systems, medical devices, and third parties, but organizations vary significantly.
HHS specifically emphasizes asset inventory and vulnerability management as important healthcare cybersecurity practices.
Why is manufacturing detection different?
Manufacturing environments may include OT and ICS systems with unique reliability and safety constraints.
NIST SP 800-82 Rev. 3 specifically addresses those operational requirements.
Does Verizon publish MTTD by industry?
Verizon publishes extensive industry-specific breach findings in the DBIR and industry snapshots, but its 2026 public materials do not provide the simple universal sector MTTD table shown in your current article.
What did Verizon find in 2026?
Across its overall 2026 DBIR dataset, Verizon reports that 31% of breaches began with software vulnerability exploitation and 48% involved ransomware.
What should organizations benchmark instead?
Track your own:
- Critical MTTD;
- median detection;
- P90/P95 detection;
- external discovery;
- detection by environment;
- detection by attack type.
Is NIST SP 800-61 Rev. 2 still current?
No.
NIST finalized SP 800-61 Rev. 3 in April 2025, superseding Rev. 2.
Final Takeaway
Detection speed differs by industry, but there is no defensible universal 2026 table that says every financial institution detects attacks in 6–12 hours or every healthcare organization takes 24–72 hours.
The stronger way to compare industries is to understand the architecture and threat profile.
Healthcare has challenges around:
legacy systems + medical assets + third parties.
Manufacturing and energy have:
OT + industrial systems + safety constraints.
Finance has:
high-value identity + fraud + transaction risk.
Technology has:
cloud + SaaS + token/identity exposure.
Retail has:
e-commerce + ransomware + supplier exposure.
Verizon’s 2026 research confirms that industries face different breach patterns, while NIST and CISA guidance reinforces the need for risk-based, environment-specific cybersecurity measurement rather than one-size-fits-all benchmarks.
The best benchmark is therefore not:
“Are we faster than another industry?”
It is:
“Are we detecting our highest-risk attack scenarios faster than we did last quarter, and where are our longest visibility gaps?”
That is a much more defensible cybersecurity measurement strategy.
Recommended Links
Use these naturally:
Average Cyber Attack Detection Time 2026
MTTD vs MTTR vs MTTC vs Dwell Time
Cybersecurity Incident Response Timeline
Third-Party Risk Assessment Checklist
Use around 6–7 contextual internal links.